Daily Football Combo Predictions: A Clear Guide to Probabilities

Daily football combo predictions group several forecasts together. To understand them properly, separate each individual estimate from the chance of the whole combination being correct. A high percentage beside one fixture does not establish the reliability of a complete ticket, and daily delivery says nothing about accuracy.
This guide explains the terminology, shows an original football software screen and sets out the evidence needed to assess prediction claims. It is an educational guide, not a list of bets to place.
What does “combo” mean in football predictions?
The word has two common meanings. It can describe a collection of forecasts for different matches, or several conditions within one match. A daily email containing three predictions is not automatically the same thing as an accumulator that depends on all three being correct.
A match result, a total-goals forecast and a both-teams-to-score forecast answer different questions. Always identify the event being predicted and the period it covers: first half, normal time or another explicitly stated period.
The essential distinction: a forecast is an estimate about an outcome. A result is what happened. A screenshot of one successful result is not a complete performance record.
Read the software screen before reading the percentage
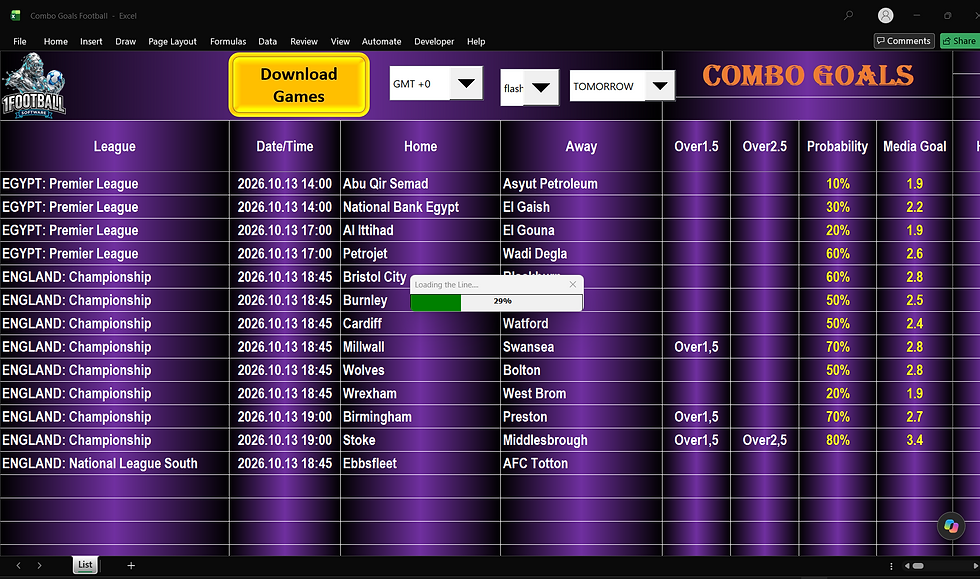
Original Combo Goals software screenshot supplied by AI Football Tips. It shows an Excel fixture list, goal indicators and a loading window at 29%. The dated rows are historical interface examples, not current selections.
The screen displays League, Date/Time, Home and Away columns, followed by Over 1.5, Over 2.5, Probability and Media Goal. These labels help organise the output, but the screenshot alone does not explain the formula, the historical sample or which event every percentage refers to.
For example, a row displaying 80% cannot be treated as an 80% chance that an entire combination succeeds. The percentage needs a clearly defined outcome and supporting validation. Likewise, the label “Media Goal” should not automatically be described as a formally validated expected-goals model.
Because the capture was taken while loading, it is evidence of the interface rather than proof that every row had completed its update. A blank indicator should not be interpreted as a negative prediction without the software’s documented meaning.
What the common goal labels actually mean
Over 1.5 total goals means at least two goals in the stated period. A 1–1 score satisfies that condition; 1–0 does not. Over 2.5 means at least three goals, so 2–1 satisfies it while 1–1 does not.
Both teams to score means each team scores at least once. It is not interchangeable with Over 2.5: a 1–1 result satisfies both teams to score but not Over 2.5, while 3–0 satisfies Over 2.5 but not both teams to score.
A correct-score forecast is narrower again. Predicting 2–1 requires that exact score, whereas a forecast of at least three total goals includes many different scorelines. Percentages for these different events should not be compared as though they measure the same thing.
Why combined confidence falls
Consider a purely illustrative probability example, unrelated to any current fixture or software claim. Three mutually independent events each have a 70% probability. The probability that all three occur is 0.70 × 0.70 × 0.70 = 34.3%. It is not 70%, and adding the percentages is meaningless.
Illustrative example: one event, 70%; two independent events both occurring, 49%; three all occurring, 34.3%; four all occurring, 24.01%. These figures demonstrate uncertainty, not a recommended combination.
That multiplication requires mutual independence. Conditions within the same match are often related: if the final score is 2–1, both teams have necessarily scored. Treating those conditions as independent would misrepresent the joint probability.
Separate matches can also share influences, and model errors can be shared even where match outcomes are approximately independent. A reliable analysis explains its assumptions rather than treating every displayed percentage as a fact.
How to assess a daily prediction service’s claims
Start with a complete record. Useful evidence includes predictions saved before kickoff, a clear market definition, the publication time, every subsequent result and a consistent rule for cancelled or postponed fixtures. Highlight reels and winning screenshots omit the denominator.
Next, ask what “win rate” measures. An individual-selection success rate is different from the percentage of complete combinations that succeed. A figure based on a small sample, selected leagues or a favourable period should not be presented as universal accuracy.
Check whether the evidence is a backtest or a forward record. A backtest evaluates historical data; a forward record preserves forecasts before the outcomes are known. Results from data used to develop a model can overstate how well it handles unseen matches.
Finally, separate accuracy from financial outcomes. A success rate by itself does not establish profitability. This article does not verify a return, endorse an advertised percentage or guarantee that any prediction service will outperform chance.
A practical evidence checklist
Can the reader identify the exact fixture, competition and prediction period? Is the forecast timestamped? Is the percentage tied to a named outcome? Is the underlying sample described? Are unsuccessful forecasts retained? Are changes to the model recorded?
If those questions cannot be answered, treat the output as an unverified estimate. A polished dashboard, AI label or frequent update schedule does not fill the evidence gap.
Daily delivery is a service feature, not a quality measure
Email delivery, Telegram access and an Excel dashboard describe how information reaches a reader. They do not demonstrate whether the forecasts are well calibrated. The same applies to the number of predictions delivered each day.
Before relying on any claimed service feature, check the current terms for access duration, delivery schedule, supported devices and what happens when no qualifying fixtures are available. Do not infer those details from an older article or a single interface capture.
Frequently asked questions
Does an AI label mean a prediction is reliable?
No. Reliability depends on the data, the method, testing on unseen outcomes and transparent reporting. The label alone does not establish any of those things.
Does an 80% estimate mean eight of the next ten matches will succeed?
No. Even a well-calibrated 80% model can have short runs with very different results. Calibration is assessed across a sufficiently large set of comparable forecasts, not guaranteed within each group of ten.
Can one successful combo prove the software works?
No. It establishes one observed outcome. Assessing a system requires a complete, timestamped record, including failures, and a clear definition of what was measured.
What is the most useful takeaway?
Read the event definition first, the percentage second and the evidence third. Keep individual forecasts separate from combination-level claims. Where the method or record is missing, uncertainty remains.
About this guide
Published by AI Football Tips, which sells football analysis tools. The original screenshot is used to explain the interface, not to substantiate a win-rate claim. The numerical example is hypothetical. No live selections or guaranteed outcomes are provided.
If predictions are used for gambling, losses are possible. Adults only; do not treat gambling as income or a solution to money problems.