How to Get Live Football Goal Predictions from AI Software

To get live football goal predictions from AI software, start with a tool that supports in-play matches, follow its setup instructions, and review its goal signals alongside the match minute and current score. Before using any signal, check that the data is current and understand exactly which goal outcome the signal refers to.
The Live Football Predictions dashboard shown here brings several matches into one Excel view. You can see the teams, score, match minute and highlighted goal signals together, making it easier to identify games for closer analysis.

What does the live goals dashboard show?
Our example screenshot contains columns labelled Minute, Home, Score, Away, Corners +, 1+ Goal and 2+ Goals. Highlighted cells display the words “Goal signal”.
Here is a plain-language reading of the four visible rows. Team names are shortened from the display for readability.
France vs Belgium: minute 73, score 0–1. Goal signals displayed in both goal columns.
Italy vs Türkiye: minute 74, score 2–1. Goal signal displayed in the 1+ Goal column.
Ukraine vs Hungary: minute 74, score 0–1. Goal signal displayed in the 1+ Goal column.
Romania vs Sweden: minute 74, score 0–1. Goal signal displayed in the 1+ Goal column.
This is an example of the software display, not a list of current recommendations or confirmed winning predictions. The screenshot does not show fixture dates or final results.
Notice that the France–Belgium row contains a signal in both goal columns, while the other rows contain one in the “1+ Goal” column. That difference is worth checking against the software's signal definitions. A blank cell simply means no signal is displayed there in this screenshot.
How to start using live football goal predictions
1. Choose the live goals product
Start with the Live Goals Football Predictions product page. Review the current access details and requirements before ordering, particularly which Excel version and operating system are supported.
The example is displayed in Microsoft Excel, but the screenshot alone does not establish compatibility with Excel for the web, Mac or mobile devices.
2. Follow the setup instructions
Use the store's software installation guide alongside the instructions supplied with your purchase. Once setup is complete, open the live predictions view and confirm that match information is updating as described in those instructions.
Check the fixture, minute and score before interpreting an alert. If the information appears stale or differs from the match you are following, resolve that discrepancy first.
3. Read the signal with its match context
A highlighted “Goal signal” is a prompt to examine a match more closely. Read across the whole row rather than looking at the coloured cell alone.
For example, the France–Belgium row shows 0–1 at minute 73. Those details tell you the game state displayed when the screenshot was captured. They do not establish which team will score next, when a goal will happen or how the match will finish.
4. Confirm what “1+ Goal” and “2+ Goals” mean
Before matching a signal to any market, establish whether its threshold refers to additional goals after the signal, total match goals or a specific period. The column headings alone do not resolve that distinction.
For illustration, if a game is 0–1 and a signal explicitly means one additional goal before full time, a later 1–1 score would contain that additional goal. This is a counting example, not a definition of this software's settings or a predicted result.
5. Keep a complete results record
Record the fixture, signal time, score at the signal and eventual outcome. Track each signal category separately and include unsuccessful signals as well as successful ones.
This gives you a more useful basis for evaluating the tool than a selection of screenshots. The example above demonstrates how signals are presented; it does not establish an accuracy rate.
France–Belgium: a supplied signal-to-result example
The supplied images and short video illustrate how a match display can change after a goal signal. They are presented as one recorded example, rather than current tips.
First screenshot: 0–1 at minute 73
The initial dashboard shows France–Belgium at 0–1, with “Goal signal” displayed in both the “1+ Goal” and “2+ Goals” columns.
Video: 1–1 around minute 77
The short clip shows a France–Belgium match display at 1–1, with the clock around the 77th minute.
Later screenshot: 2–1 at minute 80
The second dashboard screenshot shows France–Belgium at 2–1 in minute 80, with a “Goal signal” still visible in the “1+ Goal” column.

Result image: 4–1 and Over 3.5 marked WON
The supplied result image displays “France 4:1 Belgium” and an Over 3.5 total-goals selection at decimal odds of 2.20 marked “WON”. A 4–1 score contains five goals, exceeding the 3.5 threshold.
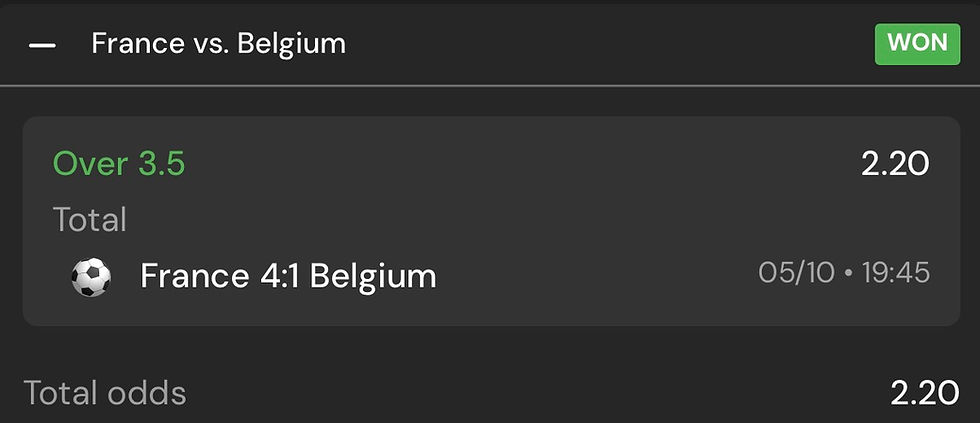
This is the outcome shown in the supplied record. The files do not establish the bet placement time, the competition or a complete history of signals. One successful example does not establish the software's overall accuracy or profitability.
Why use a dashboard for live match analysis?
The practical benefit visible in this example is organisation. Four matches appear in one view, with their scores and goal-signal columns aligned. That makes it easier to compare the displayed situations and decide which match deserves further attention.
The separate goal columns also let you distinguish between the categories the software displays, rather than treating every alert as identical. Understanding those categories is an essential part of using the tool properly.
Can AI software guarantee another goal?
No. A prediction remains uncertain, and a highlighted cell is not proof that a goal will follow. Use the software as an analysis aid, check the match context and judge its performance using a complete record.
If you use predictions for betting, only risk money you can afford to lose and never chase losses.
Get started with Live Goals Football Predictions
Explore the Live Goals Football Predictions software, check the requirements and follow the installation instructions. Begin by learning how the dashboard and signal definitions work, then build a consistent record of the signals you follow.