Portugal vs Norway: Understanding Football Model Probabilities

MODEL EXPLAINER • PORTUGAL / NORWAY
Football model screenshots can place a predicted score, match-outcome percentages and goal estimates together on one screen. Each figure answers a different question. This Portugal–Norway example shows why reading the labels—and checking whether the numbers are internally consistent—is essential.
The key distinction: 78.5% is displayed beside the home-win outcome. It is not the probability of the 6–0 scoreline.
The screenshot at a glance
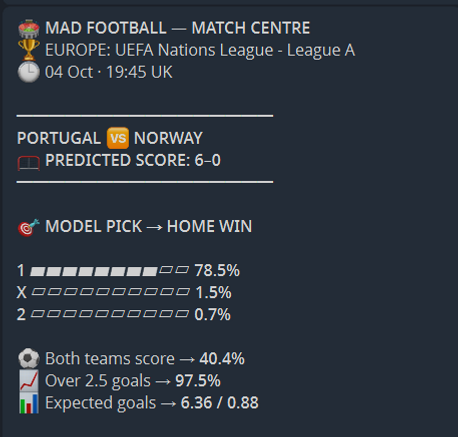
Source: screenshot supplied by the site owner. Its header labels the fixture as Portugal vs Norway, UEFA Nations League – League A, on 04 Oct at 19:45 UK. Those are the screenshot’s labels; this article does not independently confirm the fixture, competition or kick-off time.
Displayed field | Value in the screenshot | How to read it |
Predicted score | 6–0 | A displayed score scenario; no exact-score probability is shown. |
Home / draw / away | 78.5% / 1.5% / 0.7% | These total 80.7%, so they do not form a complete probability distribution as displayed. |
Both teams score | 40.4% | A separate estimate for both teams scoring at least once. |
Over 2.5 goals | 97.5% | An estimate for three or more total goals, not for a 6–0 result. |
Expected goals | 6.36 / 0.88 | Model-labelled home and away estimates; the method is not supplied. |
An important consistency check
For a standard home-win, draw and away-win forecast covering the same match and period, the three outcomes are mutually exclusive and collectively exhaustive: exactly one must occur. Their probabilities should therefore total approximately 100%, allowing for rounding.
Here, 78.5% + 1.5% + 0.7% equals 80.7%. The 19.3-percentage-point gap is too large to be explained by ordinary rounding to one decimal place. The screenshot does not reveal whether this reflects a display problem, a calculation issue, mismatched definitions or something else. It would be misleading to silently redistribute the missing percentage or treat these figures as a validated probability distribution.
Why a home-win estimate is not an exact-score estimate
A home win includes many scorelines: 1–0, 2–0, 2–1 and 6–0 are examples. A percentage for that broad outcome does not transfer to one particular score. The screenshot displays 6–0 but provides no percentage specifically attached to it, so its estimated likelihood cannot be established from this image.
Similarly, a prominent “model pick” label describes the software’s selected outcome. It does not add evidence about the model’s accuracy or resolve inconsistencies elsewhere in the output.
Reading the goal figures separately
The 97.5% figure beside Over 2.5 goals describes an estimate for three or more total goals. That category includes many different results and says nothing by itself about which team scores them. The 40.4% both-teams-score figure addresses another event: each side scoring at least once.
The values 6.36 and 0.88 appear under “Expected goals”. Their arithmetic sum is 7.24, but the screenshot does not provide the calculation method. They should be described as the model’s labelled estimates, rather than assumed to be independently measured shot-based expected-goals statistics. Expected values can contain decimals and do not dictate the exact final score.
What is needed to assess reliability?
A reliable assessment needs more than a single screen. Useful supporting information includes the forecast’s generation time, the match identifier, the data update time, the model version and a documented explanation of every displayed metric. The outcome-probability discrepancy should be resolved before these numbers are presented as a coherent forecast.
Performance evidence should include a complete record of predictions and results, with misses retained and the evaluation rules stated in advance. Calibration asks whether events assigned a given probability occur at roughly that frequency across many comparable forecasts. One screenshot cannot demonstrate calibration or establish a success rate.
What this example tells us
This Portugal–Norway screenshot illustrates several different kinds of football-model output, but its match-outcome percentages are incomplete as displayed. The 6–0 score is a scenario without an accompanying exact-score probability. Keeping those facts clear allows readers to understand the presentation while recognising what still needs verification.
Editorial note: this is an educational explanation of supplied material, not a confirmed match report or a recommendation to act on the forecast.